SHRI/RDS
2013 Survey on Business Prospects/Wage Increase/Bonus & Views on
Population/Productivity Concerns.
|
1.0
Introduction RDS surveyed 147 companies in June 2013 to find out about their business
prospects, wage, bonus and recruitment plans. Companies were also asked for their views on the tightening of foreign
labour policies use of the wage credit scheme, solution to the low fertility
problem and overcoming productivity barriers. 2.0
Summary of Key Findings Companies
generally still optimistic despite lingering worries. 2.1
Most companies are cautiously optimistic. This is
reflected in moderate wage increases, bonuses and recruitment plans that are
broadly similar to those of the second half of last year. 2.2
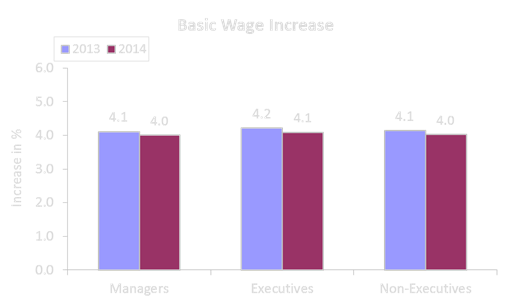
This year’s basic wage increase will average 4.1%
slightly higher than last year’s 4.0%. For next year 2014, it is expected to
be slightly lower at 4%. 2.3
This year’s variable bonus (excluding AWS) will
average 1.7 to 2.0 months. For 2014, they are expected to be 1.8 to 2.0
months 2.4
Total wage increase for this year is expected to
be 4.2%, and with the Consumer Price Index expected to be 2 to 3%; there will
be 1.2 to 2.2% increase in real wages. For
next year, the total wage increase is expected to be 4.1%, and with inflation
expected to be around 3.1%, real wages are expected to increase by 1.0% 2.5
On recruitment, 75% of companies hired or planned
to hire staff this year, slightly lower than the 78% last year. 2.6
Compared to last year, fewer companies retrenched
or planned to retrench this year. For
next year, many companies are not able to make any projection on retrenchment
although 1% of companies, so far, expect to retrench. 2.7
This year, staff turnover is reported at 5 to 7%,
very similar to the 5 to 8% last year. For next year, staff turnover is
expected to be 4 to 7%. 2.8
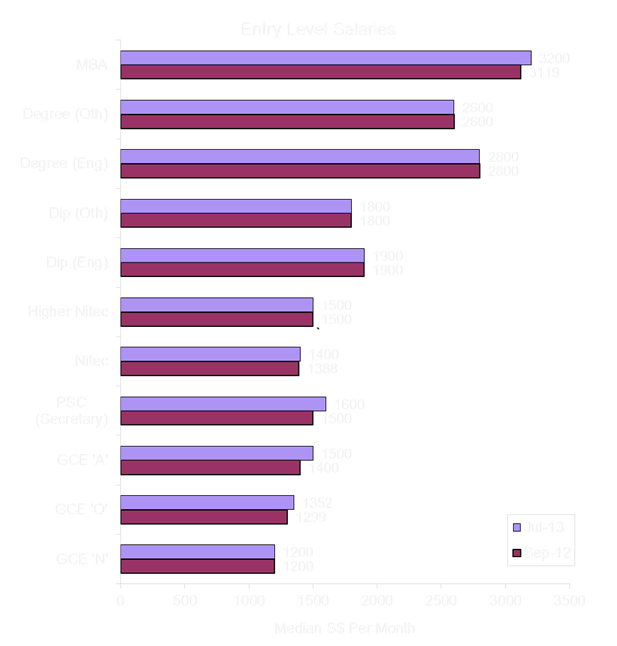
Entry level salaries for GCE ‘O’, GCE ‘A’, PSC
(Secretary), Nitec and MBA qualifications increased
by 0.9% to 7.1% compared to last year; while those for GCE ‘N’, Higher Nitec, Diploma and Degree remained unchanged. 2.9
On the issues of tightening foreign worker
policies, the Wage Credit Scheme (WCS), reduced fertility and productivity
barriers, almost all of the companies surveyed weighed in with their views. These
views are very interesting and wide-ranging – they range from insightful to
the somewhat expected and surprising. 2.9.1 On
the impact of tightened foreign worker policies, most companies (57%) think it
will result in higher wages for lower-skilled workers – what is surprising is
that only 19% think this will dampen economic growth. 2.9.2 On
the use of the WSC, one-third of companies will increase wage increment while
most of the rest will use it to increase either welfare benefit or bonus. 2.9.3 To
solve the reduced fertility problem, many companies feel that living and
child-upbringing costs need to be reduced together with more flexi-work –
what is surprising is that only 18% think more leisure time for younger workers
is needed. 2.9.4 On
overcoming productivity barriers, not surprisingly, streamlining of work
processes and use of appropriate technology top the list. Somewhat
surprisingly, the emphasis of group rather than individual productivity and
the promotion of collaborative work-culture are also highly called for. More effective top management incentives ranks very lowly
with only 15% citing their importance.
3.0 Key
Findings 3.1 Business Prospects Current: 85% of companies reported
satisfactory or better business prospects compared to 78% in September last
year. -
the
most satisfied sector is Engineering & Related. Less companies
reported unsatisfactory business prospects 15% compared to 21% in September
last year. -
the
least satisfied sector is Consumer Products/Retail Overall, most
companies are optimistic. Compared to last
year, more companies are satisfied except for the US companies (78% of US
companies reported satisfied, compared to 88% last year). Large companies
are faring better than the rest (94% satisfied or better compared to 82% of
small and medium-sized companies). Next
6 months: 16% of companies expect
prospects to improve, 76% expect no change while 8% expect prospects to
worsen. -
Engineering
& Related is the most optimistic sector, -
Logistics
sector is the most pessimistic.
Japanese companies are most optimistic over next 6 months, (were
the least optimistic last year) while European & local companies are the
least optimistic. In terms of size, large companies are
the most optimistic. 3.2 Basic Wage Increase The wage increase this year (2013) will
average 4.1%, slightly higher than
the 4.0% projected in September 2012. Highest Paying Sector : General
Manufacturing (4.4 to 5.5%) Lowest Paying Sector : IT/HiTech (3.5% to 3.6%). This year, 7% of the
companies have frozen or plan to freeze wages, and none has cut or plan to
cut wages. For 2014, the wage
increase is projected to be slightly lower at 4.0%.
For 2014, the sector
projecting the highest wage increase of 4.4% to 5.4% is General
Manufacturing. And for the lowest wage increase, it is the 2.6 to 3.6% of the
Electronics sector. 3.3 Variable Bonus
(excluding AWS) For 2013, the variables bonuses
are expected to average at: 2.0 months for Managers 1.8 months for Executives 1.7 months for
Non-executives. Highest Paying Sector -
Engineering & related (2.8 months; higher than the 1.7 to 2.2 months,
reported in Sep 2012) Lowest Paying Sector -
Electronic sector at 0.6 to 0.7 month. Large companies will pay
somewhat higher bonuses (2.0 to 2.5 months) than the 1.5 to 2.0 months of the
small and medium-sized companies. More companies expect to
pay bonuses this year, 92% compared to the 89% last year. For next year 2014, 79%
of companies expect to pay some form of bonus and the bonuses are expected to
increase slightly to: 2.0 months for managers 1.9 months for executives
and 1.8 months for
non-executives. The highest bonus paying
sector next year will still be Engineering and related which expect to pay an
average of 2.7 months while the lowest paying sector, will continue to be
Electronics sector at 0.6 to 0.7 month. 3.4 AWS In 2013, 86% of companies will pay an
average of one month while for next year only 80% of companies expect to do
so. 3.5 Recruitment A total of 75% of the companies hired or will
hire staff this year, slightly lower, compared to the 78% of last year. For next year 2014, less companies (52%) plan to
hire staff. The numbers to be hired for non-managerial staff are somewhat
higher. The average number recruited per company in 2013 and the number
to be recruited next year are:
18% of companies this year are freezing recruitment and for next
year, 14% expect to freeze recruitment. 3.6 Retrenchment This year 8% of companies retrenched or plan to
retrench, fewer than the 12% last year -
surprisingly, it is the Chemicals
& related sector which has the highest rate of retrenchment with about
40% of companies retrenching or expecting to retrench this year. For next year, only 1% of the companies, so far,
plan to retrench. 3.7 Staff
Turnover 86% of companies experienced staff turnover in 2013, slightly
higher than the 84% last year. The annual turnover rate for this year will average: 5% for Managers 6%for Executives and 7% for Non-Executives. For next year, 51% of companies are likely to
experience staff turnover with the turnover rate expected to be slightly
lower. 3.8
Total Accumulated Monthly Variable Component (MVC) in % Fewer companies, 48% of
companies currently pay the MVC and the average accumulated amount is more
than last year, 9.0% for Manager (8.5% in
year 2012) 8.6% for Executives 8.5% for Non Executives.
3.9
Entry-Level Salaries
Entry-level salaries for
GCE “O”, GCE “A”, PSC (Secretarial), Nitec and MBA
qualifications increased by 0.9% to 7.1% compared to September 2012. Those for GCE “N”, Higher
Nitec, Diploma and Degree remained unchanged. 3.10 Impact of Tightened Foreign Worker
Policies Not surprisingly, 57% of companies feel the main impact
would be higher wages for lower-skilled workers – for labour-intensive
sectors like construction, services, consumer products/retail, the
proportions are much higher (60% to 100%) . However, only 30% feel that this would lead to
restructuring of lower-skilled work and 24% feel that it would result in
increased employment of home-makers/elderly. 19% of companies expect that economic growth will be dampened
while 18% expect increased outsourcing of lower-skilled work – for both these
two impacts, the proportion of Construction companies is 60%.
3.11 Use of Wage Credit Scheme (WCS) Surprisingly, only one-third of companies will use it to
increase the wage increment while another 21% will spend it on welfare
benefit and 17% on bonus.
3.12 Solution to Low Fertility Rate More pro-active government efforts to lower
living costs (65%), reduction of child-upbringing costs (65%), more government
funds for child-upbringing & related needs (64%) and more flexi-work
(56%) top the list of solutions. Surprisingly, more leisure time for
younger workers is last on the list as only 18% feel this would be a
solution.
3.13 Overcoming Productivity Barriers Not surprisingly, streamlining of work processes
(79%), use of appropriate technology (63%) top the list of things to do to
overcoming productivity barriers. What is surprising is the relative high ratings of
group rather than individual productivity and promotion of collaborative work
culture at 55% and 54% respectively with improving of employee work-life
balance rated by 52% of companies. Next are increases in: soft-skills/collaborative training (48%), respect/recognition/career advancement for
workers (45%), worker participation in
decision-making/innovation (44%) & adoption of HR best practices (42%). Surprisingly, not many companies cite the need
for: increase in capital investment (18%) reduction of wage disparity (16%) more effective top management incentives (15%)
and increase of foreign labour/talent (7%).
If you wish to participate in any of our future surveys, click here |
||||||||||||||||||||||||||||||||||||||||||||||||||||||||||||||||||||||||||||||||||||||||||||||||||||||||||||||||||||||||