RDS
2014/2015 Survey on Business Prospects/Wage Increase/Bonus & Skills vs
Degree.
|
1.0
Introduction RDS surveyed 110 companies in October 2014 to find out about their
business prospects, wage, bonus and recruitment plans. As productivity is still an ongoing concern, Companies were also asked
for their views on how they are investing to improve productivity. As for the
skills vs degree qualification issue their views were also sought as this
issue is particularly important to both employees and employers. 2.0
Summary of Key Findings - Fourth Year of Cautious Optimism 2.1 Companies
are slightly less optimistic than a year ago so it is no surprise that they
continue to be careful on wage increases, bonuses and recruitment as they
have been for the last four years since 2010 after the recovery from the
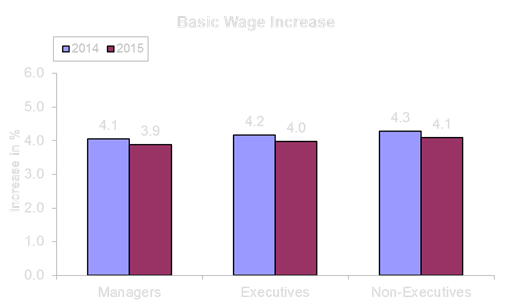
global financial crisis. 2.2 The
wage increase in 2014 averaged 4.1 to
4.3%. This increase is not only similar to last year’s but also that of
the past four years. Not surprisingly next year’s increase is also projected
to be around the same but slightly lower range of 3.9 to 4.1%. 2.3 This
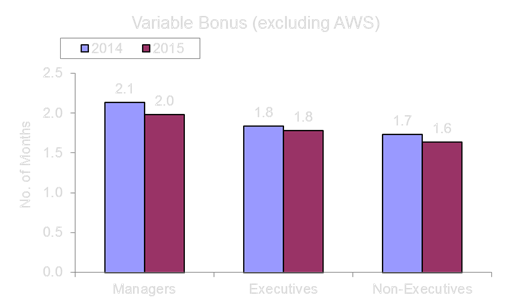
year’s variable bonus (excluding AWS) will average 1.7 to 2.1 months; -
for 2015, they are likely to be slightly lower at
1.6 to 2.0 months 2.4 The
total wage increase for 2014 is 4.3%, and with the Consumer Price Index at
1.8%; the real wage increase is 2.5%; -
for 2015, the total wage increase is expected to
be 3.3%, and with CPI expected to be around 2.2%, real wages are expected to
increase by 1.1% 2.5 This
year, 83% of the companies hired staff, higher than the 80% in 2013; -
next
year, however, not only are there less companies intending to hire (65%) but the number to be hired is also expected to be
lower. 2.6 More More
companies retrenched staff this year, 10% of the companies compared to the 6%
in 2013; for next year only 1% of the companies, so far, plan to retrench. 2.7 This
year, 86% of companies experienced staff turnover, less than the 90% in 2013;
next year, fewer companies (50%) are likely to experience staff turnover and
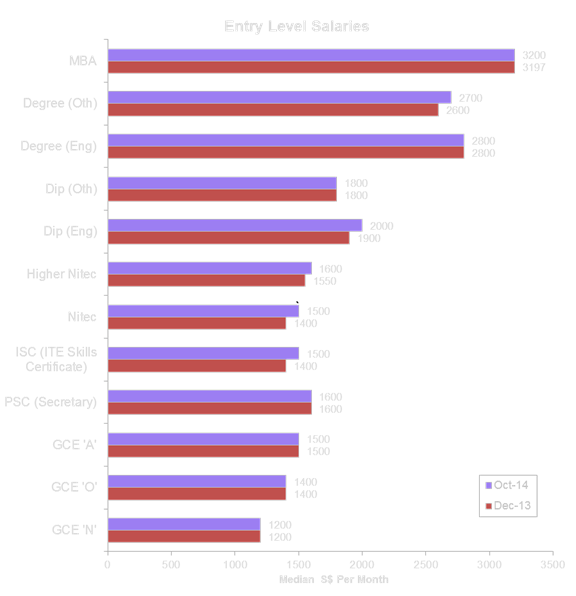
the turnover rate is also expected to be slightly lower. 2.8 Vocational
entry-level salaries including those for diploma (Engineering) and Degree
(Others) increased by 3 to 7% compared to last year. 2.9 To
improve productivity most companies are investing in task-oriented measures
like work processes and training rather than work culture. However, this may
be somewhat
unfortunate as having the right culture can
not be over-stated as it has an important impact on all other
productivity-related factors. 2.10 On
the question of Skills vs Degree Qualification, most companies (96%)
responded that job-fit/skills are not only emphasised over and above degree
qualification but practically all of them have undertaken some measures to
reinforce this such as providing continous
learning/training and recruiting for job-fit/skills rather than sheer
qualifications.
3.0 Key Findings 3.1 Business Prospects Current: 80% of companies reported satisfactory
or better business prospects; this is lower than the 88% in December 2013; - the most
satisfied sectors are Chemicals, F&B/Hotels, Healthcare/Pharmaceuticals
and Services. More companies reported
unsatisfactory business prospects 20% compared to 12% last year. - the least
satisfied sector is still Consumer Products/Retail, similar to last year.
Japanese and US companies were
the most satisfied (90% satisfied or better) followed by European (83%) and
Asia Pacific companies (75%). Local companies were the least satisfied (72%).
Large companies fared better
than the rest (90% satisfied or better compared to 71% of small and
medium-sized companies). Next 6 months: 15% of companies expect
prospects to improve, 79% expect no change while 6% expect prospects to
worsen. - Marine/Shipping is the most optimistic
sector, - Engineering sector is the least
optimistic.
Japanese
companies are most optimistic over next 6 months, while US
and Local companies are the least optimistic. In
terms of size, large companies are optimistic, while medium and small
companies are least optimistic. 3.2 Basic Wage Increase The wage increase
in 2014 averaged 4.1 to 4.3%
similar to that of last year. Highest
Paying Sector : Trading (4.6 to 5.2%) Lowest Paying Sector : Electronics
(2.8 to 3.3%). In 2014, 1% of the
companies cut wages; more companies froze wages 7% of companies compared to
3% in 2013. For next year 2015 it is
projected to be also around this range but slightly lower at around 3.9 to 4.1%.
For 2015, the sector
expecting the highest wage increase continues to be Trading (4.2% to 5.0%).
And Electronics sector continues to be the lowest wage increase, 2.6 to 3.0%.
While large companies
expect a wage increase of only 3.9% this year, the medium sized companies
expect to pay 4.0 to 4.3 %. Small companies expect a smaller
wage increase (3.7 to 4.0%) compared to last year (4.2 to 4.5%). Overall, Japanese
companies which paid the highest increases of 4.1 to 4.5% also expect to pay
the highest increases of 4.1 to 4.3% for 2015. 3.3 Variable Bonus
(excluding AWS) For
2014, the variables bonuses will average: 2.1 months for
Managers 1.8 months for
Executives 1.7 months for
Non-executives. Highest
Paying Sector – Healthcare/Pharmaceuticals (2.7 to 3.0 months) Lowest Paying Sector –
Electronics (0.7 to 1.1 months) Large
companies will pay higher bonuses (2.6 to 3.1 months) than the 1.4 to 1.9
months of the small and medium-sized companies. Slightly
less companies paid bonuses, 88% compared to 90% in 2013. For
next year 2015, 83% of companies expect to pay some form of bonus and the
bonuses are expected to be: 2.0 months for
managers 1.8 months for
executives and 1.6 months for
non-executives.
The highest bonus paying
sector next year will be Logistics sector which expect to pay bonuses of 2.8
to 3.8 months while the lowest paying sector, will be Consumer
Products/Retails sector at 0.7 to 0.9 months. The wage increase in 2014
is 4.3 % and for next year it is expected to be 3.3%. With CPI this year expected
to at 1.8%, the real wage increase this year is around 2.5% while next year
it is projected to be lower at 1.1%. In 2014, 88% of companies paid an average of 1.1 month while for
next year only 85% of companies expect to pay the AWS 3.6 Recruitment In 2014, a total of 83% of the companies hired staff, higher
than the 80% in 2013. For next year 2015, 65% of the companies plan to hire staff. The average number recruited per company in 2014 and the number
to be recruited next year are:
17% of companies froze recruitment in 2014 and for next year,
15% expect to freeze recruitment. 3.7 Retrenchment More companies retrenched staff this
year, 10% of the companies compared to the 6% in 2013. For next year only 1% of the companies, so far, plan to
retrench. 3.8 Staff
Turnover This year, 86% of companies
experienced staff turnover, less than the 90% in 2013. The annual
turnover rate for 2014 averaged: 5% for Managers 8%for Executives
and 8% for
Non-Executives. For next year fewer companies
(50%) are likely to experience staff turnover and the turnover rate is also
expected to be slightly lower. 3.9
Total Accumulated Monthly Variable Component (MVC) in % of Monthly Salary Slightly fewer
companies, 50% compared to 53% in 2013, paid the MVC. The average accumulated
amount is more than the 9.2 to 9.5% in 2013. In 2014 the MVC averaged: 10.0% for Manager
10.0% for
Executives 11.1% for Non
Executives.
3.10
Entry-Level Salaries
Vocational skill qualifications saw
increases in entry level salaries compared to last year as follows: ISC (ITE Skills Certificate) $100 or 7.1% Nitec $100
or 7.1% Higher Nitec $ 50 or 3.2% Diploma (Engineering) $100 or 5.3% and Degree (Others) $100
or 3.8%. 3.11 Investing to Improve
Productivity In our survey last year practically all companies agreed that
employee attitude and organisational culture affect productivity. However,
just over one third actually invest in improving work culture; more companies
invest in task-oriented measures like work processes and training. This is
unfortunate as having the right culture can not be
over-stated as it has an important impact on all other productivity-related
factors. We find companies continuing to invest in:
3.12 Job-Fit/Skills
vs Degree 3.12.1 On
the question of Skills vs Degree Qualification, most companies (96%)
responded that job-fit/skills are emphasised over and above degree
qualification. 3.12.2 The measures that Companies have already
taken to enhance job-fit/skills are:
If you wish to participate in any of our future surveys, click here |
||||||||||||||||||||||||||||||||||||||||||||||||||||||||||||||||||||||||||||||||||
|
|
||||||||||||||||||||||||||||||||||||||||||||||||||||||||||||||||||||||||||||||||||