HCS/RDS
2015/2016 Survey on Business Prospects/Wage Increase/Bonus & Work Stress.
|
1.0
Introduction HCS and RDS surveyed 90 companies in December 2015 to find out about their
business prospects, wage, bonus and recruitment plans. Companies were also asked for their views on work stress as this is
becoming more prevalent affecting not only worker health and safety but also
productivity and profits. 2.0
Summary of Key Findings - Fifth Year of Cautious Optimism
2.1 Despite
the lack of cheer and continuing glum about the economy, the good news is
that companies are only slightly more cautious compared to last year. 2.2 2015’s
basic wage increase averaged 3.5 to
4.0% slightly lower than the 4.1 to 4.3% in 2014, -
for
2016, the basic wage increase is expected to be marginally lower at 3.5 to
3.7 %. 2.3 This
year’s variable bonus (excluding AWS) averaged 1.8 months; - for 2016, it is also likely to be slightly
lower at 1.5 to 1.7 months 2.4 The
total wage increase for 2015 was 3.3%, and with the Consumer Price Index at
minus 0.2%, the real wage increase was
3.5%; - for 2016, the total wage
increase is expected to be 2.7%, and with CPI expected to be around 1.1%,
real wages are expected to increase by 1.6% 2.5 On
recruitment, 78% of companies hired staff in 2015, fewer than the 83% in
2014; - for
2016, however, not only are there less companies hiring (71%) but the number
to be hired is also expected to be lower.
2.6 Fewer
companies retrenched, 8% in 2015 compared to the 10% in 2014 - for 2016 only 3%
of companies, so far, expect to retrench. 2.7 Staff
turnover was lower in 2015 than the year before; - for
2016, less companies are expected to experience staff turnover, 72% compared
to 85.6% in 2015 and the turnover rate is also expected to be slightly lower. 2.8 Work
stress is very prevalent as practically all companies are affected quite seriously
- 74% of management staff and
38% of executive staff are experiencing significant to a lot of stress, but, fortunately,
only 7% of rank and file staff are similarly
affected. 2.9 Causes
of work stress are mainly job demand, tight deadlines, lack of support, long
hours, lack of resources, boss/co-worker relationships and lack of autonomy. 2.10
The steps that companies can and should take to
address these concerns are, fortunately, not very difficult as they involve
mainly top-down initiatives such as regular staff/management review on
job/workload and work stress issues among others.
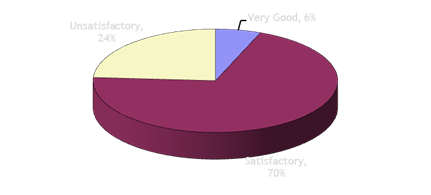
3.0 Key Findings 3.1 Business Prospects Current: 76% of companies reported satisfactory
or better business prospects compared to 80% last year -
the
most satisfied sector was Healthcare/Pharmaceuticals. More companies reported unsatisfactory
business prospects 24% compared to 20% last year -
as
in last year, the least satisfied sector was Consumer Products/Retail.
European companies were the
most satisfied (100% satisfied or better) followed by Japan and Asia Pacific
companies (86%). Local and US companies were the
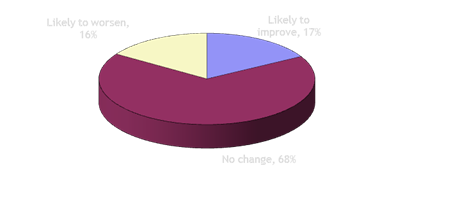
least satisfied (67%). Next 6
months: 17% of companies expect
prospects to improve, 68% expect no change while 16% expect prospects to
worsen - Construction/Property is the
most optimistic sector, - Trading sector is the least
optimistic.
European companies are most
optimistic over next 6 months, while US companies are the least optimistic. In terms of size,
medium-sized companies are optimistic, while large and small companies are
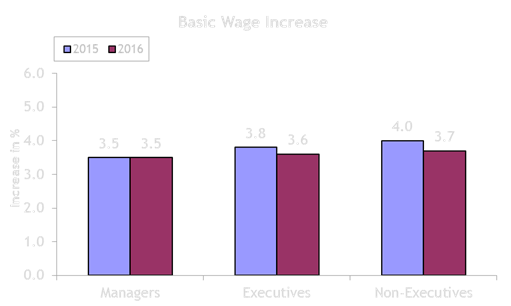
least optimistic. 3.2 Basic Wage Increase The wage increase in 2015 averaged 3.5 to 4.0%,
lower than the 4.1 to 4.3% in 2014. Highest Paying Sector : Construction/Property
(4.2 to 5.3%) Lowest Paying Sector : Consumer
Products/Retail (2.9 to 3.7%). In 2015, 3% of the
companies cut wages; more companies froze wages, 9% of companies compared to
7% in 2014. For next year 2016, the
wage increase will average 3.5 to 3.7% with 7% of the companies planning to
freeze wages and 1% planning to cut wages.
For 2016, the sector
expecting the highest wage increase is Chemicals/Oil&Gas (3.9% to 4.3%) with Financial &
Related sector expecting to have the lowest wage increase, 2.6 to 3.0%. Medium-sized companies
paid the highest wage increases, 3.8 to 4.5% in 2015 while small companies
paid the least (3.1 to 3.4%). Large companies paid wage increase at averaged
of 3.9% in 2014, remain the same this year, and expect to be 3.9 to 4.0% in
2016. Overall, local companies
paid the highest increases of 3.6 to 4.3% in 2015 and for 2016,
Japanese companies expect to pay the highest increases of 3.8 to 4.0%. 3.3 Variable Bonus
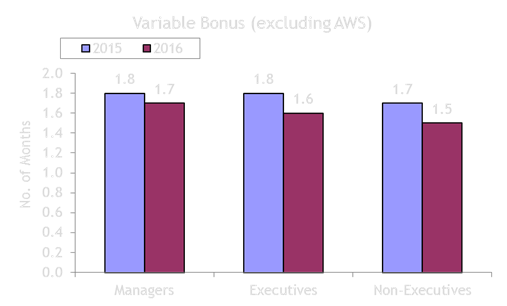
(excluding AWS) For
2015, the variables bonuses averaged: 1.8
months for Managers 1.8 months for
Executives 1.7 months for Non-executives. Highest Paying Sector –
Chemicals/Oil&Gas (3.0 months) Lowest Paying Sector –
Consumer Products/Retails (0.3 to 0.6 months) Large
companies paid higher bonuses (2.2 to 2.4 months) than the 1.4 to 1.8 months
of the small and medium-sized companies.
More
companies paid bonuses this year, 92% compared to the 88% in 2014. For
next year 2016, 84% of companies expect to pay some form of bonus and the
bonuses are expected to be: 1.7
months for managers 1.6 months for
executives and 1.5 months for
non-executives.
The
highest bonus paying sector next year will continue to be Chemicals/Oil &
Gas sector which expect to pay bonuses at 2.3 to 2.4 months while the lowest
paying sector, will continue to be Consumer Products/Retails sector at 0.4 to
0.7 months. In
2015, 88% of companies paid an average of 1 month while for next year 89% of
companies expect to pay the AWS. 3.5 Recruitment In
2015, a total of 78% of the companies hired staff, fewer than the 83% in
2014. For next
year 2016, 71% of the companies plan to hire staff. The
average number recruited per company in 2015 and the number to be recruited
next year are:
More
companies froze recruitment 27% of the companies this year (17% in 2014); for
2016, 30% expect to freeze recruitment.
3.6 Retrenchment Slightly
fewer companies retrenched this year, 8% of the companies compared to 10% in
2014. For next
year, 3% of the companies plan to retrench.
3.7 Staff
Turnover This
year, 86% of companies experienced staff turnover. The
annual turnover rate for 2015 averaged: 6%
for Managers 10% for
Executives and 10% for
Non-Executives. For next year fewer companies (72%) are likely to experience staff turnover and the turnover rate is also expected to be slightly lower. 3.8 Total
Accumulated Monthly Variable Component (MVC) in % of Monthly Salary Slightly
more companies, 56% compared to 50% in 2014, paid the MVC. The average
accumulated amount is less than the 10.0 to 11.1% in 2014. In 2015 the MVC
averaged: 10.5%
for Manager 10.1% for
Executives 9.9% for Non
Executives.
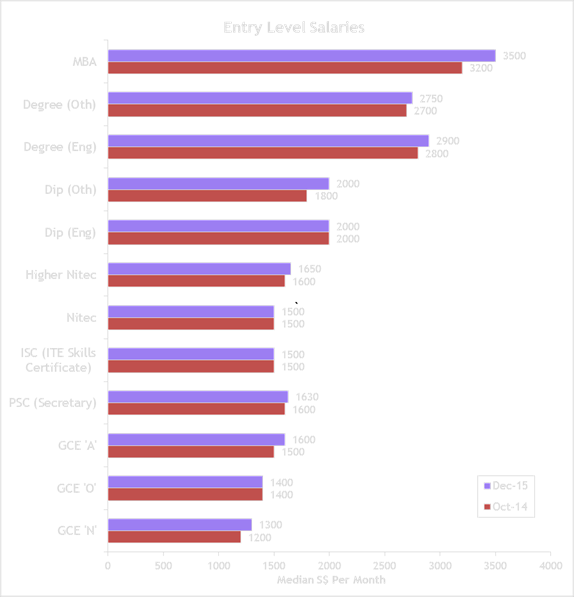
3.9
Entry-Level Salaries
At the lower end, GCE ‘N’ & ‘A’ saw
increases of $100, PSC(Secretary) $30, Higher Nitec $50 while at the tertiary levels, Diploma(Oth) saw increases of $200, Degree(Engineering) $100,
Degree(Oth) $50 and MBA $300. 3.10 Work Stress 3.10.1 Practically all companies reported that their management staff, executives and also the rank and file are experiencing some form of work stress - 74% of management staff are
experiencing very significant to a lot of stress compared to 38% of
executives and only 7% of rank and file. 3.10.2 The main causes of stress are:
3.10.3 The steps that companies can and should take to address work
stress are:
If you wish to participate in any of our future surveys, click here |
||||||||||||||||||||||||||||||||||||||||||||||||||||||||||||||||||||
|
|
||||||||||||||||||||||||||||||||||||||||||||||||||||||||||||||||||||