HCS/RDS 2017 Survey on Business Prospects/Wage Increase/Bonus & CFE
Strategies.
|
1.0
Introduction RDS surveyed 75
companies in April 2017 to find out about their business
prospects, wage, bonus and recruitment plans. Companies
were also asked for their views on the Strategies recommended by the
Committee on the Future Economy (CFE). 2.0
Summary of
Key Findings 2.1 Companies
are slightly more optimistic than last year but, as in previous years, still
cautious on wage increases, bonuses and recruitment. 2.2 2017’s
basic wage is expected to average at 2.9
to 3.1% slightly lower than the 3.2% in 2016; - for 2018, it
is expected to be around 3.2 to 3.3%. 2.3 Variable
bonus (excluding AWS) is expected to average 1.5 to 1.7 months; - for 2018, it is also likely to be
maintained at 1.5 to 1.7 months 2.4 The
total wage increase for 2017 is expected to be 2.7% and with the Consumer
Price Index projected at 0.7%; the real
wage increase will be around 1.9%; 2.5 On
recruitment, fewer companies hired staff this year (65%) compared to last
year (75%), and the numbers hired or to be hired are also lower; - for
2018, not only are there less companies hiring (51%) but the number to be
hired are also expected to be slightly lower.
2.6 Fewer
companies retrenched or planned to retrench, 9% in 2017 compared to the 12%
in 2016. 2.7 Less companies
experienced staff turnover (81% compared to last year’s 87%) and the turnover
rate is also expected to be lower this year;
- for
2018, less companies (53%) are expected to experience staff turnover but the
turnover rate is expected to remain the same. 2.8 Entry-level
salaries are generally mixed to slightly higher, two were slightly down, four
remained unchanged and six entry-level salaries increased by about 2 to
5%. 2.9 Of the
seven CFE Strategies, the most relevant to the companies are: Strengthen
enterprise capabilities to innovate and scale up - 60% Acquire
and utilise deep skills - 53% Partner
one another to enable growth and innovation -
41% 2.10
The other strategies that should also be considered are: Adapt/discard
out of date HR policies with evidence-based ones - 55% Use
behavioural science findings to review policies/ regulations -
29% Use
“Nudge” strategies to promote optimal/sustaining behaviours - 28% 3.0 Key
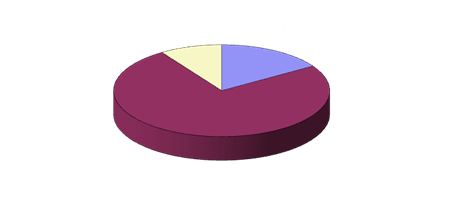
Findings 3.1 Business
Prospects Current: Slightly
more companies (75%) reported satisfactory or better business prospects
compared to last year (72%); - the most satisfied sectors are
Education, General Manufacturing, and
Healthcare & Related. Slightly
less companies (25%) reported unsatisfactory business prospects compared to
28% last year (28%); - the least satisfied sector is Trading.
Asia
Pacific companies are the most satisfied (100% satisfied or better) followed
by US companies (83%), Japan (76%),
and European companies (75%), local companies are the least satisfied
(68%). Large
and medium-sized companies fare better than the small companies (79%
satisfied or better compared to 65% of small companies). Next 6 months: 16%
of companies expect prospects to improve, 75% expect
no change while 9% expect prospects to worsen. -
Education
and Marine/Shipping are the most optimistic sector, -
Logistics
sector is the least optimistic.
US
companies are most optimistic over the next 6 months, while Asia Pacific
companies are the least optimistic. Large
and medium-sized companies are still relatively optimistic, compared with the
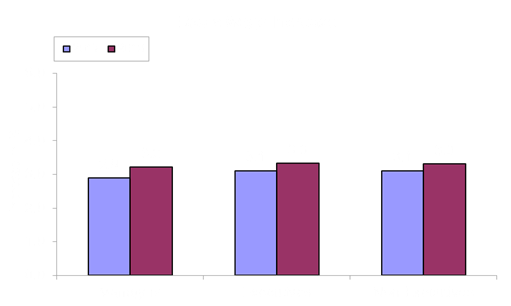
small companies. 3.2 Basic
Wage Increase The wage increase in 2017
averaged 2.9 to 3.1% lower than
the 3.2% in 2016. Highest Paying Sector : General
Manufacturing (3.8 to 4.3%) Lowest Paying Sector : Trading
(1.8 to 2.0%). This year, 1% of the
companies cut or expect to cut wages, similar to last year; more companies,
however, froze or expect to freeze wages, 23% compared to 13% in 2016. For next year 2018, the
wage increase will average 3.3% with 9% of the companies planning to freeze
wages and 1% planning to cut wages.
This year, large
companies paid or will pay wage increases of 2.9 to 3.2%, medium-sized
companies 3.0 to 3.4% and small companies 2.7 to 2.8%. For 2018, wage
increases are expected to be slightly higher. For 2018, the sector
expecting the highest wage increase is Education (4.0%) with Trading
continuing to be the lowest paying sector at 1.8 to 2.0%. Overall, Japan companies
paid or will pay the highest increases of 3.9 to 4.0%; and US companies the
lowest wage at 2.1 to 2.4%. For 2018, Japan companies continue to expect the
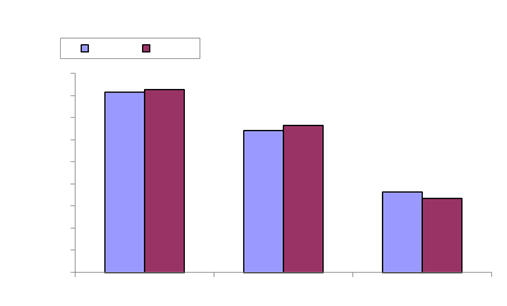
highest increases of 3.8 to 3.9%. 3.3 Variable
Bonus (excluding AWS) For 2017, 87% of companies
will pay variable bonuses averaging: 1.7 months for Managers 1.6 months for Executives 1.5 months for
Non-executives. Highest Paying Sector – Chemical & Related (2.6 to 2.9 months) Lowest Paying Sector –
Marine & Shipping (0.4 to 0.9 months) Large companies will pay
higher bonuses (2.1 to 2.5 months) than the 0.9 to 1.7 months of the small
and medium companies. For next year 2018, 80%
of companies expect to pay some form of variable bonus and the bonuses are
expected to be: 1.7 months for managers 1.6 months for executives
and 1.5 months for
non-executives.
The highest bonus paying
sector next year will continue to be Chemical & Related sector which
expect 2.4 to 2.6 months while the lowest paying sector, will be
Marine/Shipping sector at 0.5 to 0.8 months. In 2017, 91% of companies
paid an average of 1 month of AWS while for next year 88% of companies expect
to pay the AWS also averaging 1 month. 3.5 Recruitment In 2017, a total of 65%
of the companies hired or will hire staff, fewer than the 75% in 2016. For next year 2018, 51%
of the companies plan to hire staff. The average number recruited
or to be recruited per company in 2017 and the number to be recruited next
year are:
This year, 35% of the companies
froze or expect to freeze recruitment, compared to the 45% in 2016. For next
year, 28% of the companies expect to freeze recruitment. 3.6 Retrenchment 9% of the companies retrenched or plan to retrench
this year, compared to the 12% in 2016. For next year, none of the companies, so far, plan
to retrench. 3.7 Staff Turnover This year, so far, 81% of
companies experienced staff turnover. The annual turnover rate
for 2017 expected to average: 2% for Managers 4% for Executives and 6% for
Non-Executives. For next year fewer
companies (53%) are likely to experience staff turnover but the turnover rate
is expected to remain the same. 3.8 Total
Accumulated Monthly Variable Component (MVC) in % of Monthly Salary Slightly fewer companies,
56% compared to 60% in 2016, paid or will pay the MVC. The average
accumulated amount is slightly more than the 8.1 to 8.3% in 2016. In 2017 the
MVC will average: 9.8% for Manager 9.6% for Executives 9.4% for Non Executives.
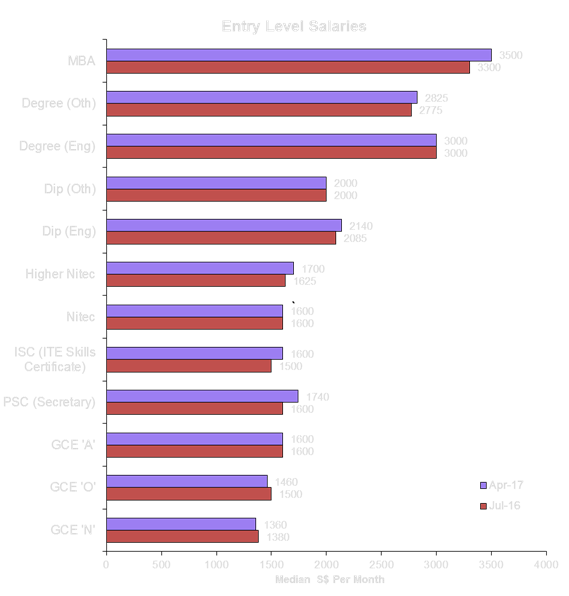
3.9
Entry-Level Salaries
Entry-level
salaries for GCE ‘N’ and GCE ‘O’ decreased slightly by $20 to $40. Those
for PSC(Secretary), ISC(ITE Skills Certificate), Higher Nitec,
Diploma(Engineering), Degree(Others) and MBA increased by 2% to about 5%. GCE
‘A’, Nitec, Diploma(Other),
and Degree(Engineering), however,
remain unchanged. 3.10
Relevance of Strategies Recommended by Committee
on Future Economy (CFE) The Strategies that are relevant to companies
depend, obviously, on individual company circumstances and existing
strategies. The key ones and the proportion of companies that they apply to
are:
3.11
Other Strategies That Should Also be Considered For many companies
besides broad strategies, existing HR policies & practices also need to
be scrutinised and improved as indicated below:
If you wish to participate in any of our future surveys, click here |
||||||||||||||||||||||||||||||||||||||||||||||||||||||||||||
|
|
||||||||||||||||||||||||||||||||||||||||||||||||||||||||||||
 .
.